
Crime map of Tennessee: uncover shocking danger hotspots
- Crime Maps: What They Really Show
- Top Dangerous Cities in Tennessee: The Risky Towns You Should Know
- Danger Zones in Tennessee: Identifying The Sketchy Neighborhoods
- How to Read and Filter Crime Reports on Tennessee’s Map
- Community Crime: How Local Efforts Are Fighting Back
- Comparing Tennessee’s Crime Map With Other US States’ Dangerous Cities
- Common Misconceptions About Crime Maps and Safety in Tennessee
- Opinions From Real Tennesseans On Crime and Safety
- What You Need To Remember About Tennessee’s Crime Map
- Sources and References
Crime Maps: What They Really Show
Crime maps are tools that show where different types of crime incidents happen across a region. In Tennessee, these maps pull data from local law enforcement agencies who report incidents like thefts, assaults, and sex offenses. The interactive crime map Tennessee lets you zoom in on neighborhoods, filter by crime type, and see recent reports.
Sometimes, you might notice areas on the map that say “no data.” That doesn’t always mean no crime happened there. It could be that the local police department hasn’t shared their reports yet or the area is too small to show detailed info. Knowing this helps avoid misunderstandings when you’re checking your own neighborhood.
The main types of crimes you’ll see on these maps include violent crimes (like assaults), property crimes (such as burglary), and sex offenses. Each is usually marked with different icons or colors, making it easier to spot patterns. Using these maps wisely means you can spot danger zones in Tennessee and plan your routes or activities accordingly.
Top Dangerous Cities in Tennessee: The Risky Towns You Should Know
Tennessee has some cities where residents and visitors notice more frequent crime incidents, but it’s important to look beyond the numbers. For example:
- Memphis has areas locals describe as sketchy spots, often linked to economic challenges and less street lighting at night. Community groups there work hard to improve safety.
- Nashville is famous for music but also has neighborhoods with higher reports of theft and assaults. Residents recommend avoiding certain blocks after dark.
- Chattanooga shows some rough neighborhoods, though local police and community watch programs have made strides in reducing incidents.
- Knoxville has pockets where crime clusters, but many residents say neighborhood patrols and better lighting have helped.
Other cities like Murfreesboro, Jackson, Clarksville, Franklin, Johnson City, and Bartlett have their own crime snapshots, with some areas flagged as dodgy or unsafe places in US terms. Common factors include low police presence at night, poorly lit streets, and isolated spots.
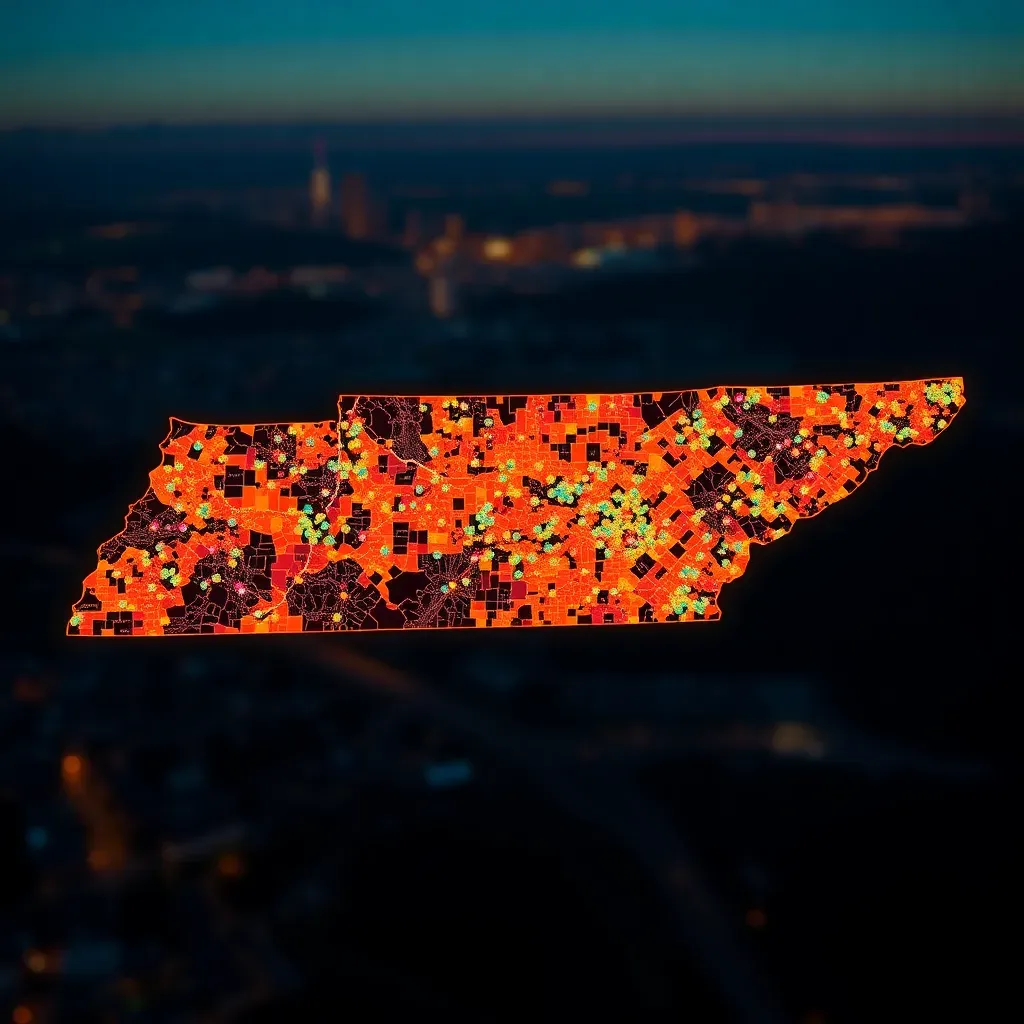
Danger Zones in Tennessee: Identifying The Sketchy Neighborhoods
What makes a neighborhood a danger zone? Usually, it’s a mix of repeated incidents, low community engagement, and physical factors like poor lighting or abandoned buildings. On the crime map, these areas show clusters of incidents close together.
Residents often share stories about streets where they felt uneasy after dark or places where break-ins happened more than once. These real-life experiences help paint a fuller picture than just numbers. For example, a street with several vehicle thefts might be marked as a sketch-town on forums like Reddit.
By using the interactive crime map Tennessee, you can spot these clusters and avoid gnarly trouble zones in Tennessee. It’s a practical way to stay safe and plan your daily routes or outings.
How to Read and Filter Crime Reports on Tennessee’s Map
Getting the most out of the crime map means knowing how to zoom in and filter reports. Here’s a quick guide:
- Start by entering your city or zip code on the map’s search bar.
- Use filters to select crime types you want to see, like violent crimes or property crimes.
- Zoom in to neighborhoods or streets to get detailed incident reports.
- Set up personalized crime alerts to get notified about new incidents in your area.
Sites like crimemapping.com use automated data import from police databases, which helps keep the info fresh and accurate. Understanding incident severity also helps — for example, a vandalism report is less urgent than a robbery alert.
Community Crime: How Local Efforts Are Fighting Back
Law enforcement agencies in Tennessee play a big role in sharing crime data openly. This transparency helps communities stay informed and take action. Neighborhood watch groups use the crime map to spot patterns and organize patrols or safety meetings.
There are many success stories where once-risky neighborhoods became safer thanks to community efforts, better lighting, and increased police presence. You can get involved by joining local groups, attending meetings, or simply reporting suspicious activity.
If you want to help, contact your local police department’s public information officer or community liaison. They often provide resources and ways to participate in safety programs.
Crime Rates Comparison: Top Tennessee Cities vs. Similar US Cities
Violent Crime Rate (per 100k)
1,500
900
700
650
Property Crime Rate (per 100k)
4,200
3,500
2,800
2,600
Comparing Tennessee’s Crime Map With Other US States’ Dangerous Cities
When compared to other states, Tennessee has some cities with higher crime rates, but also many safe areas. Here’s a quick look at how Tennessee stacks up:
| City | Violent Crime Rate (per 100k) | Property Crime Rate (per 100k) | Compared US City | Notes |
|---|---|---|---|---|
| Memphis, TN | 1,500 | 4,200 | Detroit, MI | Similar high rates, economic challenges |
| Nashville, TN | 900 | 3,500 | Atlanta, GA | Growing city with mixed safety levels |
| Chattanooga, TN | 700 | 2,800 | Columbus, OH | Mid-level crime, improving community efforts |
| Knoxville, TN | 650 | 2,600 | Raleigh, NC | Lower crime, active neighborhood watch |
These comparisons show Tennessee’s risky towns in US have some common traits with other cities, like economic shifts and population growth. Learning from safer states means focusing on community programs and better data sharing.
Common Misconceptions About Crime Maps and Safety in Tennessee
It’s easy to misunderstand what a “no data” area on a crime map means. It doesn’t always mean no crime — sometimes it’s just missing info. Also, crime stats can be misleading without context. For example, a spike in reports might be due to better reporting, not necessarily more crime.
People often confuse perception with reality. A neighborhood might seem sketchy because of a few incidents, but locals may feel safe overall. Avoid falling for scare tactics or outdated info by checking multiple sources and recent data.
Reliable sources include the Tennessee Bureau of Investigation and local police websites. Rumor mills or social media chatter can exaggerate risks.
Opinions From Real Tennesseans On Crime and Safety
“I’ve lived in Memphis for 10 years, and while some areas have had incidents, community watch groups really make a difference. We feel safer knowing what’s going on.” – Local resident, Memphis
Reddit Memphis Community
“Nashville’s music scene is great, but some neighborhoods can get dicey at night. I always check the interactive crime map Tennessee before heading out.” – Young professional, Nashville
Twitter Nashville Crime Discussions
“Chattanooga’s police have been more visible lately, and crime reports on the map show fewer incidents. It’s encouraging to see progress.” – Community leader, Chattanooga
Chattanooga Pulse
What You Need To Remember About Tennessee’s Crime Map
Staying informed with the crime map of Tennessee is a smart move for anyone living or visiting the state. Use the interactive crime map Tennessee to spot danger zones in Tennessee, understand incident types, and set up alerts for your area.
Remember, no map tells the whole story — community efforts, local knowledge, and staying alert are key. Get involved with neighborhood watch programs and keep an eye on updates from law enforcement.
Navigating Tennessee’s sketchy neighborhoods is easier when you combine data with real-life insights. Stay safe, stay informed, and help build stronger communities.
Sources and References
What do you think about the crime map of Tennessee? Have you used it to stay safe or noticed changes in your neighborhood? How would you like community safety efforts to improve? Share your thoughts or questions below!
 Is Memphis dangerous? Shocking truths you won’t believe revealed
 Is Memphis safe to visit? The shocking truth you can’t miss
Si quieres conocer otros artículos parecidos a Crime map of Tennessee: uncover shocking danger hotspots puedes visitar la categoría Tennessee.
Leave a Reply