
Crime rate by city in Texas 2025: Shocking hotspots you won’t believe
- Why Crime Rates Matter When Picking Your Texas Spot
- Texas Crime in the Big Picture: How Does the Lone Star State Stack Up?
- Breaking Down Crime Rates by City: What The 2025 Data Really Shows
- The Top 20 Most Dangerous Cities in Texas for 2025: The Full Breakdown
- Spotlight on Major Texas Cities: Houston, Dallas, San Antonio, Austin, and More
- Risky Towns and Sketchy Spots Beyond the Big Cities: East Texas and Smaller Communities
- What’s Behind the Numbers? Understanding Crime Trends and Causes in Texas Cities
- How To Use This Crime Data To Stay Safe and Make Smart Decisions
- Opinions From The Streets: What Texans Really Say About Crime in Their Cities
- What The Crime Rate by City in Texas 2025 Means For You
- Sources and Further Reading
Why Crime Rates Matter When Picking Your Texas Spot
Texas is a massive state, stretching from busy urban hubs to peaceful small towns. Wherever you’re thinking about settling down, the topic of crime always comes up. Whether you’re a parent wanting a safe neighborhood for your kids, a renter hunting for a secure spot, a homebuyer weighing options, or a community leader focused on safety, knowing the crime rate by city in Texas 2025 is crucial.
People often ask, “Which places should I be cautious about?” or “Where are the sketchy spots I should avoid at night?” This article digs into the latest FBI and local police data, revealing the rough and dodgy areas, but also highlighting safer neighborhoods. We’ll keep it straightforward, no jargon, with real stats, maps, and voices from Texans who know their towns best.
Texas Crime in the Big Picture: How Does the Lone Star State Stack Up?
Texas ranks as the 4th most violent state in the US for 2025. That’s a big deal considering its huge population and sprawling cities. Several factors play into this: the sheer number of people, major highways that connect cities (which sometimes facilitate crime), and economic disparities that create pockets of vulnerability.
Here’s a quick look at the top 5 most violent states in 2025:
- 1. Louisiana
- 2. New Mexico
- 3. Alaska
- 4. Texas
- 5. Arkansas
When we talk about violent crimes, we mean serious offenses like murder, robbery, assault, and rape. These differ from property crimes, which include burglary, theft, and vandalism. Crime rates are usually measured per 100,000 people to give a fair comparison between places of different sizes.
| State | Violent Crime Rate (per 100,000 people) |
Property Crime Rate (per 100,000 people) |
|---|---|---|
| Louisiana | 1,050 | 3,500 |
| New Mexico | 980 | 3,200 |
| Alaska | 900 | 2,900 |
| Texas | 850 | 3,100 |
| Arkansas | 800 | 2,800 |
Breaking Down Crime Rates by City: What The 2025 Data Really Shows
The numbers we’ll discuss come from FBI reports, PopulationU rankings, and local police data collected between 2021 and 2024. These sources track incidents like assaults, robberies, homicides, and arrests to calculate the violent crime rate and homicide rate by city in Texas.
To keep things clear:
- Violent crime rate means how many violent crimes happen per 100,000 residents.
- Homicide rate by city in Texas focuses specifically on murders per 100,000 people.
- Crime index score is a combined measure of violent and property crimes.
- Arrests and incidents are raw counts of police actions and reported crimes.
Crime rates depend heavily on population size. A small town with 10 violent crimes might seem bad, but per capita, it could be safer than a big city with hundreds of crimes. That’s why looking at rates per 100,000 people is more useful than just raw numbers.
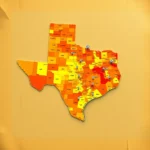
Interestingly, some smaller towns in Texas can be just as rough or unsafe as big cities. Crime isn’t only an urban issue. Below is a map highlighting Texas crime hotspots and safer zones for 2025:

Map showing crime hotspots and safer areas across Texas cities in 2025
Texas & Top 5 States Crime Rates in 2025
The Top 20 Most Dangerous Cities in Texas for 2025: The Full Breakdown
Here’s a detailed table listing the 20 Texas cities with the highest violent crime rates in 2025. It includes population, violent and property crime rates per 100,000, and the chance of being a victim.
| City | Population | Violent Crime Rate (per 100,000) |
Property Crime Rate (per 100,000) |
Chance of Being a Victim |
|---|---|---|---|---|
| Gonzales | 7,800 | 1,700 | 2,500 | 1 in 59 |
| Donna | 16,500 | 1,600 | 2,300 | 1 in 62 |
| Beaumont | 118,000 | 1,500 | 3,000 | 1 in 67 |
| Snyder | 12,000 | 1,400 | 2,200 | 1 in 71 |
| Houston | 2,300,000 | 1,000 | 4,000 | 1 in 92 |
Top 5 Cities Profiles
Gonzales This small city leads with a violent crime rate of about 1,700 per 100,000 people. Locals mention issues like economic hardship and limited police presence in some neighborhoods. Authorities recommend avoiding poorly lit areas after dark.
Donna Donna’s crime rate is close behind Gonzales. Residents report occasional incidents of robbery and assault, especially near busy commercial zones. Community groups are pushing for more patrols and youth programs.
Beaumont As a larger city, Beaumont faces challenges with gang activity and drug-related crimes in certain districts. Police have increased efforts in hotspot neighborhoods, but some areas remain shady after hours.
Snyder Snyder’s crime rate is high relative to its size. Poverty and unemployment contribute to the rough conditions in some parts. Local leaders are working on revitalization projects to improve safety.
Houston Houston, the biggest city on the list, has a violent crime rate over 1,000 per 100,000. Some neighborhoods are known for being dicey or unsafe, especially at night. Crime has risen 3.2% since 2019, with efforts underway to boost community policing.

Spotlight on Major Texas Cities: Houston, Dallas, San Antonio, Austin, and More
Let’s zoom in on the big players:
Houston The city with the highest violent crime rate in Texas, Houston has seen a 3.2% increase since 2019. Neighborhoods like Third Ward and Sunnyside often come up in local discussions as shady or dicy. Residents advise staying in well-lit, busy areas and being cautious after dark.
San Antonio Crime jumped 22.6% recently, driven by a rise in aggravated assaults and robberies. Economic challenges and rapid urban growth strain police resources. Community leaders urge residents to report suspicious activity and participate in neighborhood watches.
Dallas and Austin Both cities saw about a 9.4% increase in violent crime. Dallas’s southern neighborhoods and some parts of East Austin are often mentioned as rough neighborhoods. However, both cities have active community programs aiming to reduce crime.
Fort Worth Slightly better news here — crime dropped 0.9%. Some areas still face challenges, but overall, Fort Worth is trending safer thanks to increased patrols and community engagement.
El Paso and Lubbock El Paso’s crime rose slightly, while Lubbock saw a big 29% drop. Residents in Lubbock credit improved policing and community outreach for the positive change.
Local voices often highlight the importance of neighborhood vigilance, good lighting, and community programs in keeping crime down. Practical tips include avoiding isolated streets at night and staying informed through local police alerts.
Risky Towns and Sketchy Spots Beyond the Big Cities: East Texas and Smaller Communities
Crime isn’t just a big city problem. East Texas has its share of dodgy and messed-up places too.
Take Tyler, TX — once ranked 10th most dangerous in 2022, it dropped to 15th in 2025. This shift reflects some improvements in policing and community efforts, but locals still warn about certain areas with less street lighting and occasional incidents.
Other smaller towns with high crime rates contrast sharply with very safe small towns like Trophy Club or Southlake, which boast low violent crime rates and strong community safety programs.
Factors like poverty, unemployment, and limited police resources heavily influence crime in these areas. Residents often share stories about feeling uneasy in certain neighborhoods after dark or noticing increased drug activity.
What’s Behind the Numbers? Understanding Crime Trends and Causes in Texas Cities
Crime trends fluctuate due to many reasons:
- Economic shifts Job losses or downturns can increase desperation and crime.
- Drug issues Areas with drug trafficking often see spikes in violence.
- Gang activity Gang presence can drive up aggravated assaults and robberies.
- Policing changes Budget cuts or new strategies impact crime rates.
Aggravated assault cases and robbery statistics are key indicators of community safety. Homicide rates, while lower in number, have a big impact on public perception.
Cultural centers and urban development can either help reduce crime by fostering community or sometimes displace vulnerable populations, causing new challenges.
Experts like criminal defense lawyers and law enforcement officials note that crime-heavy places in TX can improve quickly with focused efforts, but also worsen if neglected.
How To Use This Crime Data To Stay Safe and Make Smart Decisions
Here’s how you can make sense of these numbers:
- Look beyond raw crime counts; focus on rates per 100,000 to compare fairly.
- Spot shady or wild neighborhoods by checking recent police reports and local forums.
- Use online crime maps and apps to stay updated on incidents near you.
- Consider consulting a criminal defense lawyer if you face legal trouble or want advice on local laws.
- Get involved in neighborhood watch programs or community safety groups to help improve your area.
Safe suburbs like Trophy Club, Southlake, and parts of Plano offer lower crime rates and family-friendly environments. Always visit neighborhoods at different times to get a feel for safety.
Opinions From The Streets: What Texans Really Say About Crime in Their Cities
“I’ve lived in Houston for 15 years. Some parts feel dicey at night, especially if you’re alone. But the community groups here are strong and help keep things safer.” – Local resident, Houston [source]
“Tyler’s crime has dropped, but folks still warn about certain blocks after dark. Street lighting and patrols have improved, which helps.” – Community leader, Tyler [source]
“As a parent, I check crime maps before moving. Southlake feels safe, but some nearby towns are definitely rough. It’s good to stay informed.” – Parent, Dallas area [source]
“Real estate agents tell clients to avoid certain neighborhoods in San Antonio due to rising crime. But there are also up-and-coming areas with great potential.” – Realtor, San Antonio [source]
What The Crime Rate by City in Texas 2025 Means For You
Texas is a state of contrasts when it comes to crime. Some cities and towns show grim or messed-up crime stats, while others are improving or remain quite safe. Understanding the crime rate by city in Texas 2025 helps you make informed choices about where to live, work, or visit.
Keep in mind that crime trends shift, so staying updated with the latest data and local insights is key. Use this knowledge to protect yourself and your family, and consider getting involved in community safety efforts.
Sources and Further Reading
- Texas Crime Rate by City – Latest Statistics
- These Are the 6 Most Violent Texas Cities for 2025
- The Most Dangerous Texas Cities To Live in 2025
- Safest Cities in Texas to Live in 2025
- Texas Crime Rate by City 2025
- Right Now These Are the Safest Small Towns in Texas
- Worst Places to Live in Texas in 2025
- Top 5 Safest Cities in Texas
- 2025 Crime Stats Worksheet
- These Are The Most Dangerous Cities In Texas
What do you think about the crime trends in Texas cities? Have you experienced any risky or shady neighborhoods firsthand? How would you like to see community safety improve in your area? Share your thoughts, questions, or stories in the comments below!
 Top violent cities in Texas revealed: Which places you must avoid now
 Crime map of Texas: uncover shocking hotspots you won’t believe exist
 Crime rate by city in California 2025: shocking hotspots revealed
Si quieres conocer otros artículos parecidos a Crime rate by city in Texas 2025: Shocking hotspots you won’t believe puedes visitar la categoría Texas.
Leave a Reply